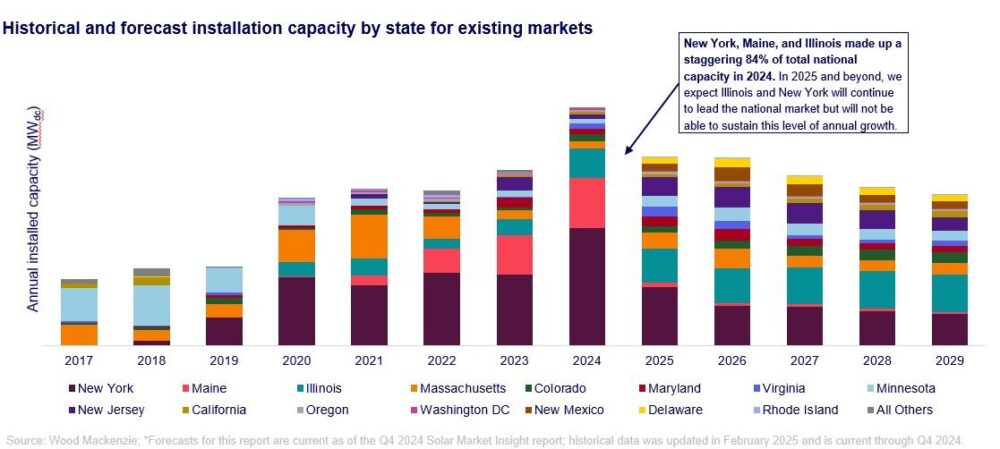
The U.S. community solar market hit an important milestone in 2024, installing 1.7 GWDC of capacity—the highest amount ever installed in a single year and a 35% increase from 2023. In a report, Wood Mackenzie authored in partnership with the Coalition for Community Solar Access (CCSA), the firm found that the majority of the growth came from three states: New York, Maine, and Illinois, which together comprised 83% of the U.S. Community solar capacity deployed now totals up to 8.6 GWDC.
While this is a substantial step forward, the community solar market is also facing policy headwinds at the state and federal level that could cloud the long-term market outlook. Although leading markets are experiencing saturation, new state programs have trickled out into adoption sustainably. Consequently, Wood Mackenzie’s base case estimates community solar annual deployments will shrink by 8% every year through 2029, resulting in a total installed capacity of slightly more than 15 GWDC. But policy progress and interconnection reforms could make this path much different.
Policy and Community Solar Market Expansion Prospects
The potential for growth remains strong, with several states—including Pennsylvania, Ohio, Missouri, Iowa, Georgia, Washington, and Wisconsin—making notable progress in advancing community solar legislation. Together, this bipartisanship support, along with community solar included within these foundational state energy plans (e.g., Pennsylvania’s Lightning Energy Plan), signals a 16% potential increase in expected capacity through 2029.
Jeff Cramer, President and CEO of CCSA, emphasized the rising demand for community solar, stating, “This record growth comes at a time when customer and grid demand for community solar has never been higher. However, barriers such as interconnection delays and policy red tape are hindering the industry’s full potential.”
LMI Community Solar Market Growth
Low-to-moderate income (LMI) subscribers represent a growing segment of the community solar market, with New York and Massachusetts leading the way. These states currently account for 49% of the 1 GWDC of LMI-serving community solar capacity. By 2026, LMI capacity is expected to increase to 18% of total community solar capacity, despite ongoing uncertainty surrounding federal incentives such as the LMI Communities adder and Solar for All funding.
Competitive Landscape and Key Players
The community solar sector remains competitive, with the top five installers securing 19% of the market in 2024. The asset owner segment remains even more consolidated, with the top 10 asset owners—led by Nexamp, AES Clean Energy, and Nautilus Solar—controlling 54% of the year’s installed capacity and 40% of cumulative capacity.
The Future of Community Solar Markets
Demand for affordable, distributed energy will continue to increase, but resolving major industry hurdles like interconnection delays and policy barriers will be key to maintaining that momentum. As bipartisan support for community-scale solar continues and new ideas in development create new opportunities for engagement with the sector, it is an encouraging thought that Biden can always rely on community-scale solar to help keep the grid up and running and to respond to increased electricity needs.
Finulent Solutions keeps a close eye on industry trends and innovations in renewable energy to provide smart, scalable solutions for a sustainable future.
Source: Solar Power World